Wednesday, 20 November 2013

Solaris Memory Utilization

Solaris servers uses certain percentage of free memory for IO cache.

This is based on the ZFS configuration.  This configuration can be checked using root or kernel access.

If there is no memory available, then these cache memory will be used.

If the Application need memory, the I/O cache will release the memory.

The "sr" value on vmstat provide the status of the Memory swap rate.

As long as the "sr" value stays at zero there is no memory issue. 


Thursday, 7 November 2013

Tuesday, 1 October 2013

Weblogic DataSource

Data Source Connection Pool Sizing

One of the most time-consuming procedures of a database application is establishing a connection. The connection pooling of the data source can be used to minimize this overhead.  That argues for using the data source instead of accessing the database driver directly.
Configuring the size of the pool in the data source is somewhere between an art and science – this article will try to move it closer to science. 
From the beginning, WLS data source has had an initial capacity and a maximum capacity configuration values.  When the system starts up and when it shrinks, initial capacity is used.  The pool can grow to maximum capacity.  Customers found that they might want to set the initial capacity to 0 (more on that later) but didn’t want the pool to shrink to 0.  In WLS 10.3.6, we added minimum capacity to specify the lower limit to which a pool will shrink.  If minimum capacity is not set, it defaults to the initial capacity for upward compatibility.   We also did some work on the shrinking in release 10.3.4 to reduce thrashing; the algorithm that used to shrink to the maximum of the currently used connections or the initial capacity (basically the unused connections were all released) was changed to shrink by half of the unused connections.
The simple approach to sizing the pool is to set the initial/minimum capacity to the maximum capacity.  Doing this creates all connections at startup, avoiding creating connections on demand and the pool is stable.  However, there are a number of reasons not to take this simple approach.
When WLS is booted, the deployment of the data source includes synchronously creating the connections.  The more connections that are configured in initial capacity, the longer the boot time for WLS (there have been several projects for parallel boot in WLS but none that are available).  Related to creating a lot of connections at boot time is the problem of logon storms (the database gets too much work at one time).   WLS has a solution for that by setting the login delay seconds on the pool but that also increases the boot time.
There are a number of cases where it is desirable to set the initial capacity to 0.  By doing that, the overhead of creating connections is deferred out of the boot and the database doesn’t need to be available.  An application may not want WLS to automatically connect to the database until it is actually needed, such as for some code/warm failover configurations.
There are a number of cases where minimum capacity should be less than maximum capacity.  Connections are generally expensive to keep around.  They cause state to be kept on both the client and the server, and the state on the backend may be heavy (for example, a process).  Depending on the vendor, connection usage may cost money.  If work load is not constant, then database connections can be freed up by shrinking the pool when connections are not in use.  When using Active GridLink, connections can be created as needed according to runtime load balancing (RLB) percentages instead of by connection load balancing (CLB) during data source deployment.
Shrinking is an effective technique for clearing the pool when connections are not in use.  In addition to the obvious reason that there times where the workload is lighter,  there are some configurations where the database and/or firewall conspire to make long-unused or too-old connections no longer viable.  There are also some data source features where the connection has state and cannot be used again unless the state matches the request.  Examples of this are identity based pooling where the connection has a particular owner and XA affinity where the connection is associated with a particular RAC node.  At this point, WLS does not re-purpose (discard/replace) connections and shrinking is a way to get rid of the unused existing connection and get a new one with the correct state when needed.
So far, the discussion has focused on the relationship of initial, minimum, and maximum capacity.  Computing the maximum size requires some knowledge about the application and the current number of simultaneously active users, web sessions, batch programs, or whatever access patterns are common.  The applications should be written to only reserve and close connections as needed but multiple statements, if needed, should be done in one reservation (don’t get/close more often than necessary).  This means that the size of the pool is likely to be significantly smaller then the number of users.  
If possible, you can pick a size and see how it performs under simulated or real load.  There is a high-water mark statistic (ActiveConnectionsHighCount) that tracks the maximum connections concurrently used.  In general, you want the size to be big enough so that you never run out of connections but no bigger.   It will need to deal with spikes in usage, which is where shrinking after the spike is important.  Of course, the database capacity also has a big influence on the decision since it’s important not to overload the database machine.  Planning also needs to happen if you are running in a Multi-Data Source or Active GridLink configuration and expect that the remaining nodes will take over the connections when one of the nodes in the cluster goes down.  For XA affinity, additional headroom is also recommended.  
In summary, setting initial and maximum capacity to be the same may be simple but there are many other factors that may be important in making the decision about sizing.

Sunday, 18 August 2013

Weblogic JMS Queue

  1. A JMS queue in Weblogic Server is associated with a number of additional resources:


JMS Server

A JMS server acts as a management container for resources within JMS modules. Some of its responsibilities include the maintenance of persistence and state of messages and subscribers. A JMS server is required in order to create a JMS module.

JMS Module

A JMS module is a definition which contains JMS resources such as queues and topics. A JMS module is required in order to create a JMS queue.

Subdeployment

JMS modules are targeted to one or more WLS instances or a cluster. Resources within a JMS module, such as queues and topics are also targeted to a JMS server or WLS server instances. A subdeployment is a grouping of targets. It is also known as advanced targeting.

Connection Factory

A connection factory is a resource that enables JMS clients to create connections to JMS destinations.

JMS Queue

A JMS queue (as opposed to a JMS topic) is a point-to-point destination type. A message is written to a specific queue or received from a specific queue.

2. The following steps are done in the WebLogic Server Console, beginning with the left-hand navigation menu.

2.1 Create a JMS Server

  1. Services > Messaging > JMS Servers

  2. Select New
  3. Name: TestJMSServer
    Persistent Store: (none)
  4. Target: soa_server1  (or choose an available server)
  5. Finish
The JMS server should now be visible in the list with Health OK.

2.2 Create a JMS Module

  1. Services > Messaging > JMS Modules
  2. Select New
  3. Name: TestJMSModule
    Leave the other options empty
  4. Targets: soa_server1  (or choose the same one as the JMS server) or Cluster
    Press Next
  5. Leave “Would you like to add resources to this JMS system module” unchecked and  press Finish .

2.3 Create a SubDeployment

A subdeployment is not necessary for the JMS queue to work, but it allows you to easily target subcomponents of the JMS module to a single target or group of targets. We will use the subdeployment in this example to target the following connection factory and JMS queue to the JMS server we created earlier.
  1. Services > Messaging > JMS Modules
  2. Select TestJMSModule
  3. Select the Subdeployments  tab and New
  4. Subdeployment Name: TestSubdeployment
  5. Press Next
  6. Here you can select the target(s) for the subdeployment. You can choose either Servers (i.e. WebLogic managed servers, such as the soa_server1) or JMS Servers such as the JMS Server created earlier. As the purpose of our subdeployment in this example is to target a specific JMS server, we will choose the JMS Server option.
    Select the TestJMSServer created earlier
  7. Press Finish

2.4  Create a Connection Factory

  1. Services > Messaging > JMS Modules
  2. Select TestJMSModule  and press New
  3. Select Connection Factory  and Next
  4. Name: TestConnectionFactory
    JNDI Name: jms/TestConnectionFactory
    Leave the other values at default
  5. On the Targets page, select the Advanced Targeting  button and select TestSubdeployment
  6. Press Finish
The connection factory should be listed on the following page with TestSubdeployment and TestJMSServer as the target.

2.5 Create a JMS Queue

  1. Services > Messaging > JMS Modules
  2. Select TestJMSModule  and press New
  3. Select Queue and Next
  4. Name: TestJMSQueue
    JNDI Name: jms/TestJMSQueue
    Template: None
    Press Next
  5. Subdeployments: TestSubdeployment
  6. Finish
The TestJMSQueue should be listed on the following page with TestSubdeployment and TestJMSServer.
Confirm the resources for the TestJMSModule. Using the Domain Structure tree, navigate to soa_domain > Services > Messaging > JMS Modules then select TestJMSModule
You should see the following resources
The JMS queue is now complete and can be accessed using the JNDI names
jms/TestConnectionFactory and
jms/TestJMSQueue

Thursday, 8 August 2013

XA and Non XA DataSource

An XA transaction, in the most general terms, is a "global transaction" that may span multiple resources. A non-XA transaction always involves just one resource. 

An XA transaction involves a coordinating transaction manager, with one or more databases (or other resources, like JMS) all involved in a single global transaction. Non-XA transactions have no transaction coordinator, and a single resource is doing all its transaction work itself (this is sometimes called local transactions). 

XA transactions come from the X/Open group specification on distributed, global transactions. JTA includes the X/Open XA spec, in modified form. 

Most stuff in the world is non-XA - a Servlet or EJB or plain old JDBC in a Java application talking to a single database. XA gets involved when you want to work with multiple resources - 2 or more databases, a database and a JMS connection, all of those plus maybe a JCA resource - all in a single transaction. In this scenario, you'll have an app server like Websphere or Weblogic or JBoss acting as the Transaction Manager, and your various resources (Oracle, Sybase, IBM MQ JMS, SAP, whatever) acting as transaction resources. Your code can then update/delete/publish/whatever across the many resources. When you say "commit", the results are commited across all of the resources. When you say "rollback", _everything_ is rolled back across all resources. 

The Transaction Manager coordinates all of this through a protocol called Two Phase Commit (2PC). This protocol also has to be supported by the individual resources. 

In terms of datasources, an XA datasource is a data source that can participate in an XA global transaction. A non-XA datasource generally can't participate in a global transaction (sort of - some people implement what's called a "last participant" optimization that can let you do this for exactly one non-XA item). 

For more details - see the JTA pages on java.sun.com. Look at the XAResource and Xid interfaces in JTA. See the X/Open XA Distributed Transaction specification. Do a google source on "Java JTA XA transaction". 

OSB Service Calls

OSB, Service Callouts and OQL - Part 1

Oracle Fusion Middleware customers use Oracle Service Bus (OSB) for virtualizing Service endpoints and implementing stateless service orchestrations. Behind the performance and speed of OSB, there are a couple of key design implementations that can affect application performance and behavior under heavy load. One of the heavily used feature in OSB is the Service Callout pipeline action for message enrichment and invoking multiple services as part of one single orchestration. Overuse of this feature, without understanding its internal implementation, can lead to serious problems.

This post will delve into OSB internals, the problem associated with usage of Service Callout under high loads, diagnosing it via thread dump and heap dump analysis using tools like ThreadLogicand OQL (Object Query Language) and resolving it. The first section in the series will mainly cover the threading model used internally by OSB for implementing Route Vs. Service Callouts.

OSB Pipeline actions for Service Invocations


A Proxy is the inbound portion of OSB that can handle the incoming request, transform/validate/enrich/manipulate the payload before invoking co-located or remote services. The execution logic is built using the proxy pipeline actions. For executing the remote (or even local) business service, OSB provides three forms of service invocations within a Proxy pipeline:
  • Route - invoke a single business service endpoint with (or without) a response. This happens entirely at end of a proxy service pipeline execution and bridges the request and response pipeline. The route can be treated as the logical destination to reach or final service invocation. There can be only one Route action (there can be choices of Route actions - but only one actual execution) in a given Proxy execution.
  • Publish - invoke a business service without waiting for result or response (like 1-way). The caller does not care much about the response. Just interested in sending out something (and ensuring it reaches the other side).
  • Service Callout - invoke one or more business service(s) as part of message augmentation or enrichment or validation but this is not the primary business service for a given Proxy, unlike the Route action. The service callouts can be equivalent to credit card validation, address verification while Route is equivalent to final order placement. There can be multiple Service Callouts inside a Proxy pipeline.


OSB Route Action

Most HTTP remote service invocations with responses are synchronous and blocking in nature. The caller creates a payload, connects to the business service endpoint, transmits the payload and waits for a response. The caller has to wait till the response is ready and transmitted back. Using Java Native IO, one can avoid the blocking wait for response and only read the response once its ready. But this is not an easy option for higher level applications that aim at SOAP, XML, REST forms of service interactions. They need threads to wait for the response and if the remote business services are slow, more threads can get tied up instead of working on other tasks.

When using the Route Action for HTTP based Business services, OSB does not tie up a thread waiting for the remote response. Instead it leverages Native IO within WebLogic Server Muxer Layer and Future Response AsyncServlet functionality to decouple the caller thread from the actual response handling portion thereby behaving asynchronously. When the client makes a request to OSB Proxy and the request pipeline finally executes a Route action, OSB posts the request one-way and registers a future Response Async Servlet method to receive a callback of the response.
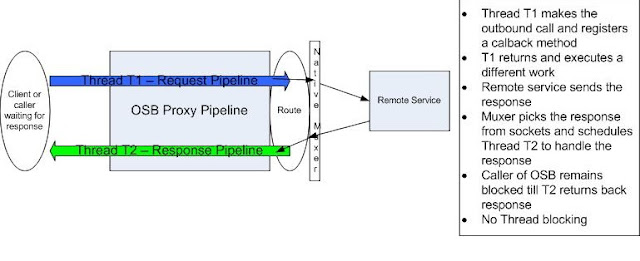


The proxy thread that processed the request pipeline path makes the outbound call and returns, without waiting for the actual response. This thread is then free to execute other pending requests. The WLS Muxer layer detects when there is response data readily available to be read from the socket for that outbound business service call and then triggers a callback to the OSB's registered Async Servlet. Now a different thread picks the response and then execute the response pipeline flow within OSB. This way, the proxy uses two threads for segregating the request from the response processing in the Route Action. This translates to OSB using minimal threads for service executions, without blocking for response, even if the remote service is slow. But for the external client calling into OSB, it appears like one synchronous blocking call, while OSB keeps its thread usage to the minimum and handles more requests, without using additional threads or waiting for remote service responses.

By default, for most HTTP based interactions for both incoming Proxy service and external Route, there would be no transactions involved and so the Route action would use Best-Effort QoS (Quality of Service) and would leverage the async threading model described previously. However, if the Route is invoked as part of an existing transaction (if the calling Proxy service was JMS with XA Connection Factory enabled or other Transactional proxy service invocation like Tuxedo or started off a Transaction in the middle of the pipeline) and wants to use Exactly-Once QoS, then the invoking Thread (T1) of the Route action blocks till a response is received and then commits the transaction. The response is only then picked by another thread  (T2) after the Route action is completely successful and transaction committed. So, the thread invoking Route will appear as blocking. If the QoS is changed to Best-Effort, then the async threading model will be used as in case of HTTP based service invocations.


OSB Service Callout Action

A Service Callout is not the actual target or end service for a Proxy Service in OSB. Its simply a service invocation to either modify, validate, transform, augment or enrich the incoming request or outgoing response within a proxy execution. It can be invoked from either the request or response path. Multiple Service Callouts can also be executed in any order or fashion. Route is the final target and so there can only be one route in a proxy execution. Service callouts are used when a response is needed from the service execution. So, the caller of the Service Callout will block till a response is available. If responses are not needed or its strictly one-way sends, Publish Action can be used.

Most users will consider the OSB Service Callout to be similar to Route action. Both are invoking some remote service and ultimately getting back some response. The caller of the proxy blocks till the response is received. The time used by the remote service in sending back the response cannot be cut down from the final proxy response time. But the request and response handling part differs considerably in the Service Callout compared to the Route Action.
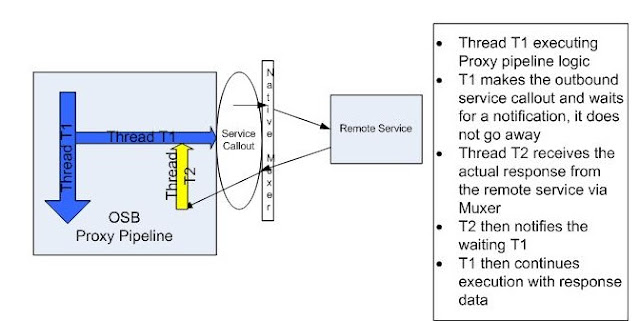

Unlike in Route where the invoking thread returns right away after making the remote invocation, the Service Callout thread T1 actually waits for a notification of response for that invocation; it does not really handle the response directly from the remote service. When the remote service sends back a response, the WLS native Muxer layer picks it and then schedules another thread T2 to handle it. The thread T2 does not really do much other than notify the waiting T1 thread of the availability of response and return. Now T1 wakes up from its waiting state and then continues execution of the rest of the proxy pipeline logic. So, in case of Service Callout, the original thread T1 actually waits for the response to become available, while another thread T2 is needed to pick the response and then notifies T1. So, essentially two threads will be used with one thread (T1) completed dedicated for duration of the service callout and beyond and another thread for a short while. In Route, threads T1 and T2 are never used concurrently and also, are not wasted or needed, when the response is yet to be sent across from the remote service.

This design implementation of Service Callout action can affect the behavior of OSB under high loads when there is heavy use of Service Callouts to either aggregate data from multiple services or just used repeatedly for VERT (Validate, Enrich, Route, Transform) messages instead of using Routing action. As more requests repeatedly use Service callouts, these can tie up valuable threads waiting for the response from remote or other local services while there are no more threads available to handle the actual incoming response and notify the waiting Service callout threads. In summary, overuse of Service callouts can lead to thread starvation issues and degraded performance under heavy loads.

For a synchronous publish (like Exactly-Once QoS Publish) that has to wait for confirmation and response, the behavior is the same as in Service Callout - requires two threads for the waiting and notification.

Summary


Hope this post gave some pointers on the internal implementation of OSB for Route Vs. Service Callouts and correct usage of Service Callouts. The remaining sections will deal with identifying issues with callouts using Thread Dump and Heap Dump Analysis and the corrective actions to resolve them

Monday, 29 July 2013

OSB Coherence

Caching using Coherence in OSB is very simple to activate and use.  The following figure illustrates what is going on behind the scenes.
Because for most cases Coherence will be able to retrieve the result from the in-memory grid on the same application server, there will be no latency introduced by network or database I/O.  This should greatly reduce the response time of your service, assuming frequent requests for the same data are made.

Thursday, 11 July 2013

Using jps and jstat to get JVM GC statistics


Using jps and jstat to get JVM GC statistics

Ensure that JDK bin directory is on your path
Issue command 'jps' to find the running JVM's PID ( it will show all running java processes ).
Once you have identifed the PID issue command 'jstat -gcutil [PID] 5000', replacing [PID] with the one identified above
Now  the console should update on a 5 second basis with statistics.
Fields available in jstat gcutil output

Basically, the first set of columns (S0, S1, E, O, P) describes the utilisation of the various memory heaps
(Survivor heaps, Eden - young generation, Old generation and Perm. heap space).

Next, (YGC and YGCT) show the number of young (eden) space collections and total time taken so far doing these collections.

Columns (FCG, FGCT) show the number and time taken doing old space collections.

Lastly, GCT shows the total time taken performing garbage collection so far.

Sample Output:
#Timestamp         S0     S1     E      O      P     YGC     YGCT    FGC    FGCT     GCT
#144415.1  0.00   0.00  10.66  21.60  51.84    567   79.287     2    1.276   80.563


OptionDisplays...
classStatistics on the behavior of the class loader.
compilerStatistics of the behavior of the HotSpot Just-in-Time compiler.
gcStatistics of the behavior of the garbage collected heap.
gccapacityStatistics of the capacities of the generations and their corresponding spaces.
gccauseSummary of garbage collection statistics (same as -gcutil), with the cause of the last and current (if applicable) garbage collection events.
gcnewStatistics of the behavior of the new generation.
gcnewcapacityStatistics of the sizes of the new generations and its corresponding spaces.
gcoldStatistics of the behavior of the old and permanent generations.
gcoldcapacityStatistics of the sizes of the old generation.
gcpermcapacityStatistics of the sizes of the permanent generation.
gcutilSummary of garbage collection statistics.
printcompilationHotSpot compilation method statistics.

Oracle - OCI - Exadata Database

Exadata Database is a scalable, private database server that is completely isolated from other tenants. It can be used to run all database ...